The purpose of this report is to provide a descriptive analysis of the scope and reach of the National Health and Medical Research Council's (NHMRC) international collaborations across all grant schemes over the past 10 years.
Publication Data
Table of contents
Lists of tables and figures
List of tables
- Table 1. Number and percentage of grants with an international collaborator by grant scheme, 2012–2021
- Table 2. Number and percentage of grants awarded through International Collaborative Schemes
- Table 3. Total commitment and percentage of all grants with an international collaborator by grant scheme, 2012–2021
- Table 4. Total commitment for each International Collaborative Scheme and percentage of total commitment, 2012–2021
- Table 5. Number of grants received by lead researcher (CIA)
- Table 6. Number of countries participating as either a partner or a participating country in grants across all grants with an international collaborator by grant scheme
List of figures
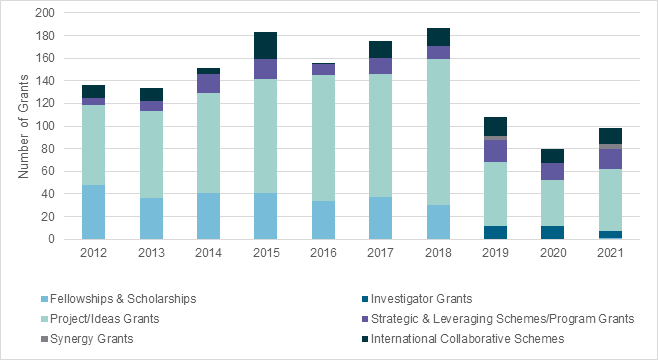
- Figure 1. Number of grants with an international collaborator by category 2012-2021
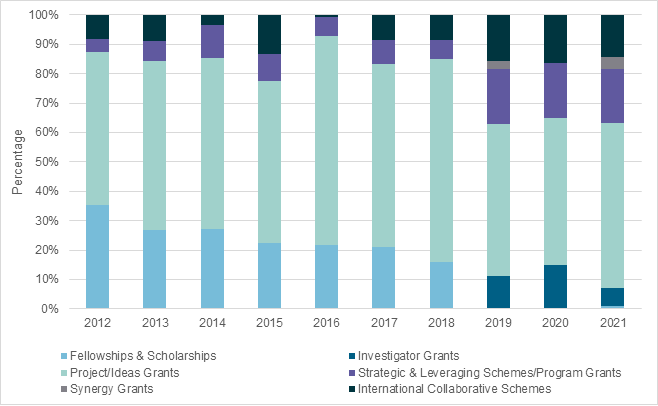
- Figure 2. Percentage of grants with an international collaborator by category, 2012-2021
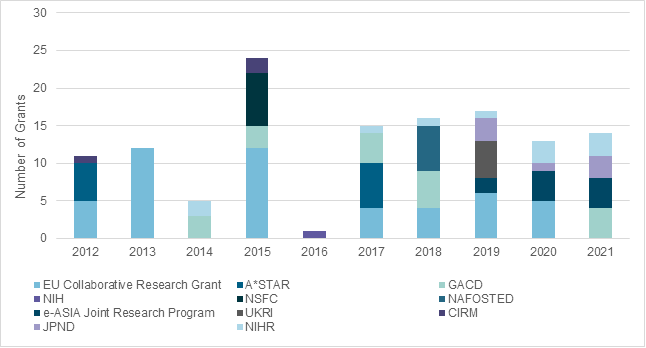
- Figure 3. Number of grants awarded through International Collaborative Schemes by partner agency 2012-2021
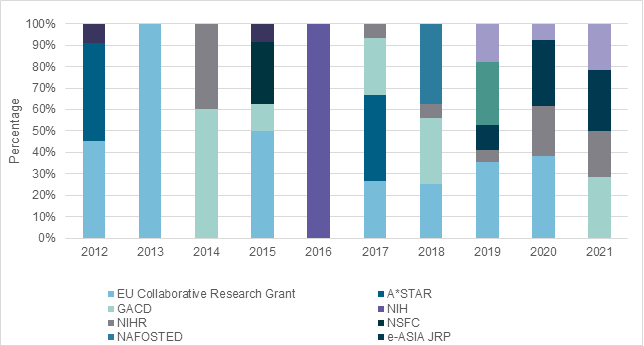
- Figure 4. Number of grants by international partner as a percentage of all grants awarded under International Collaborative Schemes each year
- Figure 5. Total commitments for grants with an international collaborator 2012-2021
- Figure 6. Total commitments by category as a percentage of the total commitment for grants with an international collaborator
- Figure 7. Total funds committed to International Collaborative Scheme grants by scheme 2012-2021
- Figure 8. Funds committed for each international scheme as a percentage of the total funds committed for International Collaborative Schemes
- Figure 9. Percentage of grants by Broad Research Area across all grants with an international collaborator
- Figure 10. Percentage of grants by Broad Research Area and category
- Figure 11. Percentage of grants in each Broad Research Area by International Collaborative Scheme
- Figure 12. Research sector of all grants with an international collaborator by category
- Figure 13. Location of Administering Institution by category for all grants with an international collaborator
- Figure 14. Number of grants with each country by category 2012-2021. Darker shades represent higher number of grants
- Figure 15. Percentage of high-income and low- to middle-income countries by category
Summary
| All grants with at least one international collaborator | International Collaborative Schemes | |
|---|---|---|
| Scope |
|
|
|
| |
|
| |
| Reach |
|
|
|
|
1. Purpose
The purpose of this report is to provide a descriptive analysis of the scope and reach of NHMRC's international collaborations across all grant schemes over the past 10 years.
Our research questions are:
- What are we funding and how much is it costing us?
- Who are we engaging with and where is the research taking place?
2. Methods and scope
This analysis includes NHMRC-funded grants from 2012 to 2021 (year of application) with at least one international participating institution or partner listed on the application; this includes schemes from all 4 streams of the current NHMRC grant program (Investigator, Synergy, Ideas, Strategic and Leveraging Grants) and the previous grant program (for example, Project Grants). In some analyses, the grants funded only through 'International Collaborative Schemes' (which falls under the 'Strategic and Leveraging Grant' stream) are examined. A qualitative and quantitative desk review was undertaken using data available from records in NHMRC's grant management systems.
Definitions
| Term | Description |
|---|---|
| Grants with international collaboration | Refers to all NHMRC-funded grants with at least one international participating institution or partner. |
| International Collaborative Schemes | Grant schemes that are administered jointly and/or co-funded by an international organisation through a bilateral or multilateral arrangement. |
| Mainstream schemes with international collaboration | Grants that are part of the current and previous major streams excluding the International Collaborative Schemes. |
| Categories | For the purposes of this analysis, grant schemes have been grouped into the following 'categories' for some analyses. These categories differ from the standard 'Streams' used in the NHMRC Grant Program because of the need to separate out the International Collaborative Schemes and account for both old and new schemes:
|
3. Findings
3.1 Scope – what are we investing in?
3.1.1 Grant schemes with international collaboration – number of grants
From 2012 to 2021, there were 1,408 grants with at least one international collaborator across NHMRC schemes. This represents 13% of all NHMRC grants awarded (10,878 grants) during the same time period.
Almost 50% of the grants with at least one international collaborator were funded through NHMRC Project Grants (2012–2018) (Table 1).
| Grant Scheme | Number | % |
|---|---|---|
| Project Grants | 686 | 48.7% |
| Early Career Fellowships | 225 | 16.0% |
| Ideas Grants | 151 | 10.7% |
| International Collaborations | 128 | 9.1% |
| Development Grants | 34 | 2.4% |
| Partnerships | 32 | 2.3% |
| Investigator Grants | 30 | 2.1% |
| Centres of Research Excellence | 29 | 2.1% |
| Clinical Trials and Cohort Studies Grants | 28 | 2.0% |
| Postgraduate Scholarships | 16 | 1.1% |
| Boosting Dementia Research Initiative | 8 | 0.6% |
| Research Fellowships | 8 | 0.6% |
| NHMRC - ARC Dementia Research Development Fellowships | 7 | 0.5% |
| Synergy Grants | 7 | 0.5% |
| Targeted Calls for Research | 6 | 0.4% |
| Career Development Fellowships | 5 | 0.4% |
| Practitioner Fellowships | 4 | 0.3% |
| Translating Research into Practice Fellowships | 3 | 0.2% |
| Program Grants | 1 | 0.1% |
| Total | 1408 | 100% |
Year by year, the total number of grants funded with an international collaborator has ranged from 80 (2020) to 187 (2018) (Figure 1); there was a steady increase from 2012 to 2018 and a substantial drop in 2019, 2020 and 2021. This may partly be due to the introduction of the new grant program which consolidated all fellowships and some Project and Program Grant funding into the Investigator Grant scheme. Year by year, the proportion of grants with an international collaborator was highest for Project Grants followed by the grant schemes in the Fellowships & Scholarships category (Figure 2). From 2019, with the introduction of the new grant program, the proportion of grants with an international collaborator was highest for Ideas Grants followed by the schemes in the 'Strategic & Leveraging Stream' category.
3.1.2 International Collaborative Schemes – number of grants
From 2012 to 2021, 128 grants were funded through the International Collaborative Schemes, which was approximately 9% of all the grants with at least one international collaborator. Among all International Collaborative Scheme grants awarded in this period, 38% were NHMRC-European Union (EU) collaborative research grants, 15% were through the Global Alliance for Chronic Diseases (GACD) and 9% were through the Agency for Science, Technology and Research (A*STAR) collaborative schemes (Table 2).
| International Collaborative Scheme | Number | % |
|---|---|---|
| NHMRC-EU Collaborative Research Grant | 48 | 37.5% |
| GACD | 19 | 14.8% |
| A*STAR | 11 | 8.6% |
| NIHR | 11 | 8.6% |
| e-ASIA Joint Research Program | 10 | 7.8% |
| NSFC | 7 | 5.5% |
| JPND | 7 | 5.5% |
| NAFOSTED | 6 | 4.7% |
| UKRI | 5 | 3.9% |
| CIRM | 3 | 2.3% |
| NIH | 1 | 0.8% |
| Total | 128 | 100% |
From 2012 to 2021, on average, 13 grants were funded per year in the International Collaborative Schemes; however, there have been fluctuations from year to year (Figure 3). The largest number of grants was funded in 2015 (24 grants) and 2019 (17 grants) and the lowest number in 2016 (1 grant) (Figure 3). Year by year, the proportion of grants funded in each scheme type within the International Collaborative Schemes varied (Figure 4).
3.1.3 Grant schemes with international collaboration – investment
Across all NHMRC schemes from 2012 to 2021, approximately $1.3 billion was committed to grants with at least one international collaborator (Table 3). This represents 14% of the total commitment for all NHMRC grants ($9.3 billion) during the same time period.
Almost 50% of the total funds committed to grants with at least one international collaborator were through Project Grants. It is important to note that the funds committed were paid to the Australian Administering Institution.
| Funding type | Total budget | % of total |
|---|---|---|
| Project Grants | $613,416,187.56 | 48.00% |
| Ideas Grants | $142,006,720.95 | 11.10% |
| International Collaborations | $89,605,170.75 | 7.00% |
| Early Career Fellowships | $80,339,908.48 | 6.30% |
| Clinical Trials and Cohort Studies Grants | $74,795,037.56 | 5.90% |
| Centres of Research Excellence | $74,675,725.78 | 5.80% |
| Synergy Grants | $35,486,394.47 | 2.80% |
| Targeted Calls for Research | $33,939,788.52 | 2.70% |
| Investigator Grants | $33,909,930.22 | 2.70% |
| Partnerships | $32,257,013.52 | 2.50% |
| Development Grants | $22,952,972.92 | 1.80% |
| Boosting Dementia Research Initiative | $21,170,360.05 | 1.70% |
| Programs | $7,302,438.57 | 0.60% |
| Research Fellowships | $5,963,844.65 | 0.50% |
| NHMRC - ARC Dementia Research Development Fellowships | $4,376,053.53 | 0.30% |
| Career Development Fellowships | $2,267,836.84 | 0.20% |
| Practitioner Fellowships | $1,951,405.33 | 0.20% |
| Postgraduate Scholarships | $1,550,848.60 | 0.10% |
| Translating Research into Practice Fellowships | $495,201.32 | 0.04% |
| Total | $1,278,462,839.62 | 100% |
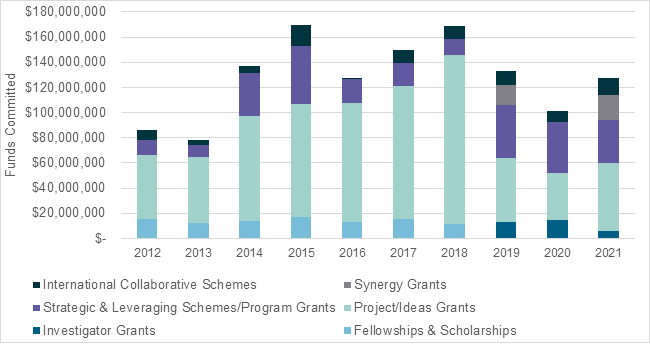
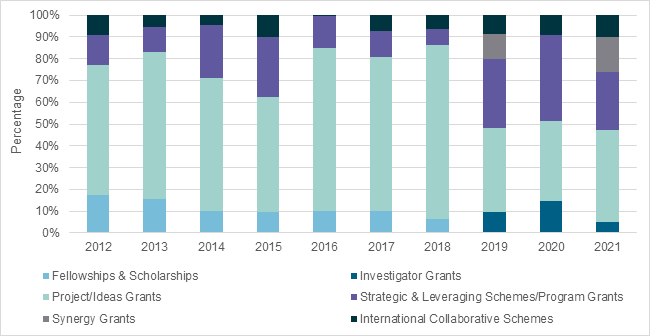
Year by year, the highest proportion of the investment went to Project/ Ideas Grants followed by funding schemes in the 'Fellowships & Scholarships' category up until 2013. In 2014-2015 and between 2019 and 2021, a higher proportion was invested in the funding schemes in the 'Strategic & Leveraging Schemes/ Program Grants' category compared to other years (Figures 5 and 6). After the implementation of the new grant program from 2019 onwards, a higher proportion of funding has been committed to Strategic & Leveraging Schemes/ Program Grants compared to previous years.
3.1.4 International Collaborative Schemes – investment
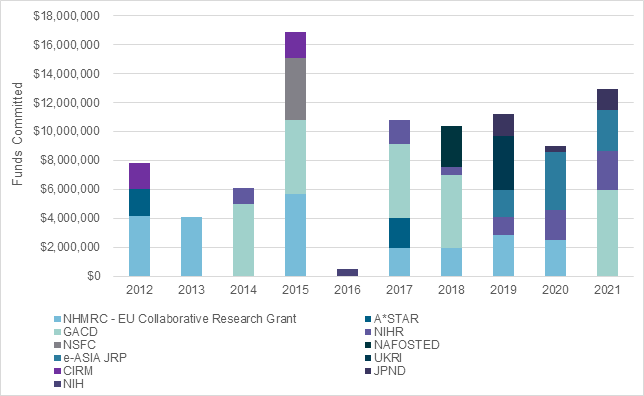
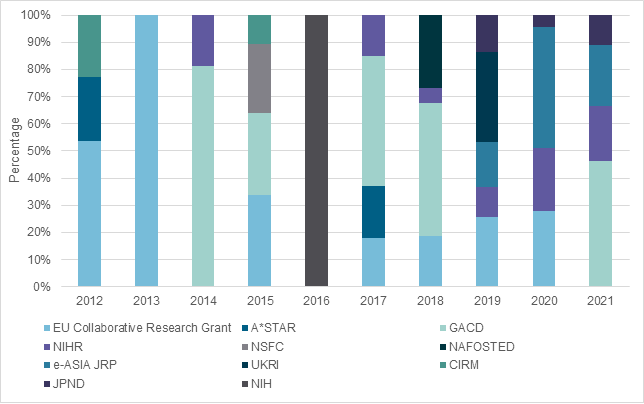
Approximately 7% ($90 million) of the total amount committed to grants with at least one international collaborator was awarded to International Collaborative Schemes (Table 4). About a third (29%) of the funds committed to International Collaborative Schemes was to GACD grants and a quarter (26%) to EU collaborative research grants. Figures 7 and 8 show the trends in investment in the different schemes within the International Collaborative Schemes.
| Funding subtype (International Collaborative Scheme) | Total commitment | % |
|---|---|---|
| GACD | $26,240,427.51 | 29.3% |
| EU Collaborative Research Grant | $23,244,907.41 | 25.9% |
| NIHR | $9,298,826.53 | 10.4% |
| e-ASIA Joint Research Program | $8,736,852.17 | 9.8% |
| NSFC | $4,240,784.23 | 4.7% |
| A*STAR | $3,890,958.36 | 4.3% |
| UKRI/NHMRC | $3,707,158.22 | 4.1% |
| CIRM | $3,583,505.41 | 4.0% |
| JPND | $3,358,243.97 | 3.7% |
| NAFOSTED | $2,802,220.63 | 3.1% |
| NIH | $501,286.31 | 0.6% |
| Total | $89,605,170.75 | 100% |
3.1.5 Broad Research Area (BRA) of grants with an international collaborator
Across all grants with an international collaborator in 2012–2021, almost half (49%) were allocated by the applicant to Basic Science, followed by Clinical Medicine and Science (31%), Public Health (15%) and Health Services Research (5%) (Figure 9). A higher proportion of grants in the International Collaborative Schemes were classified as Public Health compared to the other mainstream grant schemes (31% vs 13%). There was a much smaller proportion of Basic Science grants within the International Collaborative Schemes than in the mainstream schemes (22% vs 51%) (Figure 9). Figure 10 shows the percentages of grants by BRA within specific grant schemes.

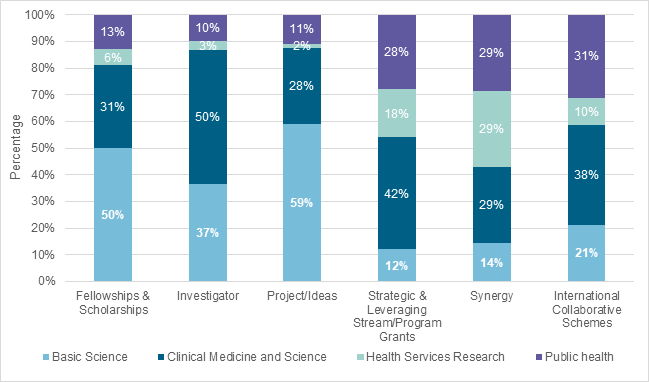
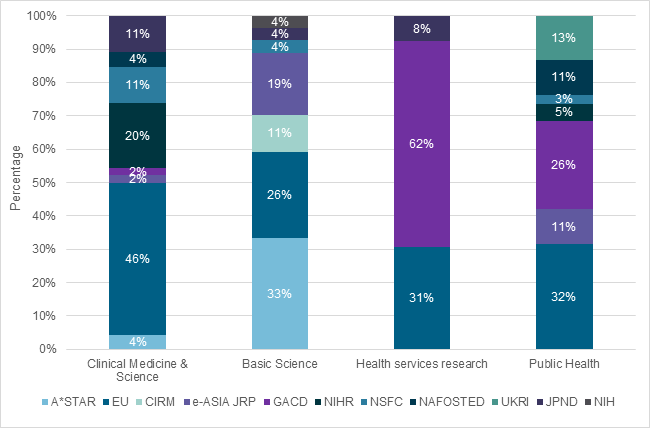
Figure 11 shows the percentage of grants in each BRA by International Collaborative Scheme. The majority of grants funded within Clinical Medicine & Science were through the EU Collaborative Research Grant scheme. For Health Services Research, it was primarily GACD grants. For the other broad research areas, there was a variety of different schemes represented.
3.2 Reach – who are we engaging with and where is the research taking place?
3.2.1 Research sector
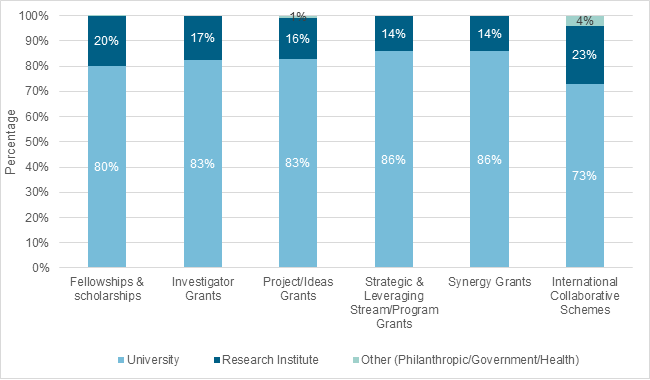
Just over 80% of all grants with an international collaborator are administered through universities followed by research institutes (17%). International Collaborative Schemes had a slightly higher proportion of grants funded through research institutes (23%) and other institutions (Government, Charity, Health) (4%) compared to the other mainstream schemes (Figure 12).
3.2.2 Location of the research within Australia
The highest percentage of grants with an international collaborator was administered through Victoria (43%) followed by NSW (25%) and QLD (15%) (based on Administering Institution location). Figure 13 shows the proportions of grants by State/Territory for each category.

3.2.3 Researchers – number of grants received by lead investigators
International Collaborative Schemes
In total, there have been 120 different lead researchers (Chief Investigator As) who have received a grant through the International Collaborative Schemes (Table 5). The majority of the lead investigators (113; 94%), have received one grant; 6 (5%) have received 2 grants and one (1%) has received 3 grants (all GACD grants).
Mainstream schemes with international collaboration – In total, there have been 1,036 CIAs who have received a grant with an international collaborator in the project team. Most of the CIAs (860; 83%) have received one grant; 130 (13%) have received 2 grants; 31 (3%) have received 3 grants. One CIA has received 6 grants within the past 10 years.
| International Collaborative Scheme | Mainstream Scheme with international collaboration | |||
|---|---|---|---|---|
| No. of Grants | No. of Researchers | % of total | No. of Researchers | % of total |
| 1 | 113 | 94% | 860 | 83.0% |
| 2 | 6 | 5% | 130 | 13.0% |
| 3 | 1 | 1% | 31 | 3.0% |
| 4 | 0 | 0% | 9 | 1.0% |
| 5 | 0 | 0% | 5 | 0.5% |
| 6 | 0 | 0% | 1 | 0.1% |
| Total | 120 | 100% | 1036 | 100% |
Twenty-five CIAs have received a grant through the International Collaborative Schemes and at least one other mainstream grant with an international collaborator.
3.2.4 Funding for researchers
Over the past 10 years, there have been a total of 298 grants awarded through postgraduate scholarships and research fellowships schemes that have included at least one international collaborator. The majority of these research fellowship grants have been awarded through the Early Career Fellowship scheme (2012-2018) and Emerging Leadership Level 1 Investigator Grants (2019-2021) (83%). There was a significant drop in the number of research fellowships with an international collaborator once the Investigator Grants (Emerging Leadership Levels 1 and 2) were introduced in 2019, collectively replacing the previous Early Career Fellowships and some Career Development Fellowships.
There have been 30 Investigator Grants awarded with at least one international collaborator from 2019 to 2021, 70% of these have been at the Emerging Leadership Level 1, 20% at Leadership Level 1 and the remaining 10% have been at Leadership Levels 2 and 3.
3.2.5 Collaborations with countries
Across all grants with at least one international collaborator, there were 72 different countries represented as either a partner or participating country. Across the grant schemes, International Collaborative Schemes had the highest number of collaborating countries (62) followed by Project Grants (43), Ideas Grants (29) and Early Career Fellowships (23) (Table 6).
| Grant Scheme | Number of countries |
|---|---|
| International Collaborative Schemes | 62 |
| Project Grants | 43 |
| Ideas Grants | 29 |
| Early Career Fellowships | 23 |
| Clinical Trials and Cohort Studies Grants | 20 |
| Centres of Research Excellence | 18 |
| Development Grants | 13 |
| Investigator Grants | 12 |
| Partnership Grants | 10 |
| Postgraduate Scholarships | 9 |
| Research Fellowships | 8 |
| NHMRC - ARC Dementia Research Development Fellowship | 4 |
| Targeted Calls for Research | 8 |
| Boosting Dementia Research Initiative | 8 |
| Translating Research into Practice Fellowships | 7 |
| Career Development Fellowships | 6 |
| Synergy Grants | 5 |
| Practitioner Fellowships | 4 |
| Program Grants | 1 |
The top 5 collaborating countries across all grants with an international collaborator were the United States, United Kingdom, Canada, Germany and New Zealand. Across the International Collaborative Schemes only, the top 5 collaborating countries were United Kingdom, Netherlands, Germany, Italy and the United States. The International Collaborative Schemes have resulted in 20 new international collaborations, that is, 20 countries that have not participated in any other mainstream grant scheme. Figure 14 shows the number of grants in each country by funding category.

3.2.6 High-income and low- to middle-income countries
Of the 72 countries that participated in all grant schemes with an international collaborator, 38 (53%) were high-income countries and 34 (47%) were low- to middle-income countries. Among the International Collaborative Schemes, 56% were high-income countries and 44% low- to middle-income countries. For the other categories, the proportion of high-income countries was at least 60% (Figure 15).

3.2.7 Number of countries per grant2
Mainstream schemes
Across the mainstream grant schemes with grants with at least one international collaborator, the majority of the grants had one other country besides Australia involved as a collaborator. Scheme types with a high number of international collaborators included Project Grants (2 projects had 7 collaborators), Centres of Research Excellence and Clinical Trials and Cohort Studies Grants (up to 5 collaborators for both schemes).
International Collaborative Schemes
Across the International Collaborative Schemes, the number of countries that were a collaborator (as a partner or participant) on a project ranged from one to 17. Forty-six percent of the grants from 2012 to 2021 had two or more countries as a collaborator. Sixteen percent (13 grants) had 10 or more countries involved in their project. Projects with very high numbers of collaborators (that is, 5 or more) were funded through the NHMRC-EU Collaborative Research Grant scheme.
Abbreviations
- GACD = Global Alliance for Chronic Diseases
- A*STAR = Agency for Science, Technology and Research (Singapore)
- e-ASIA JRP = The East Asia Science and Innovation Area Joint Research Program
- NIH = National Institutes of Health (USA)
- NIHR = National Institute for Health and Care Research (UK)
- NSFC = National Natural Science Foundation of China
- NAFOSTED = National Foundation for Science & Technology Development (Vietnam)
- UKRI = UK Research and Innovation
- CIRM = California Institute for Regenerative Medicine
- JPND = EU Joint Programme – Neurodegenerative Disease Research
1 Includes all grant schemes in the Fellowships & Scholarships category and Investigator Grants.
2 Applicants are not required to list all collaborating countries in their grant application for all scheme types which may have resulted in an under-estimate of the number of international collaborations per grant.


